


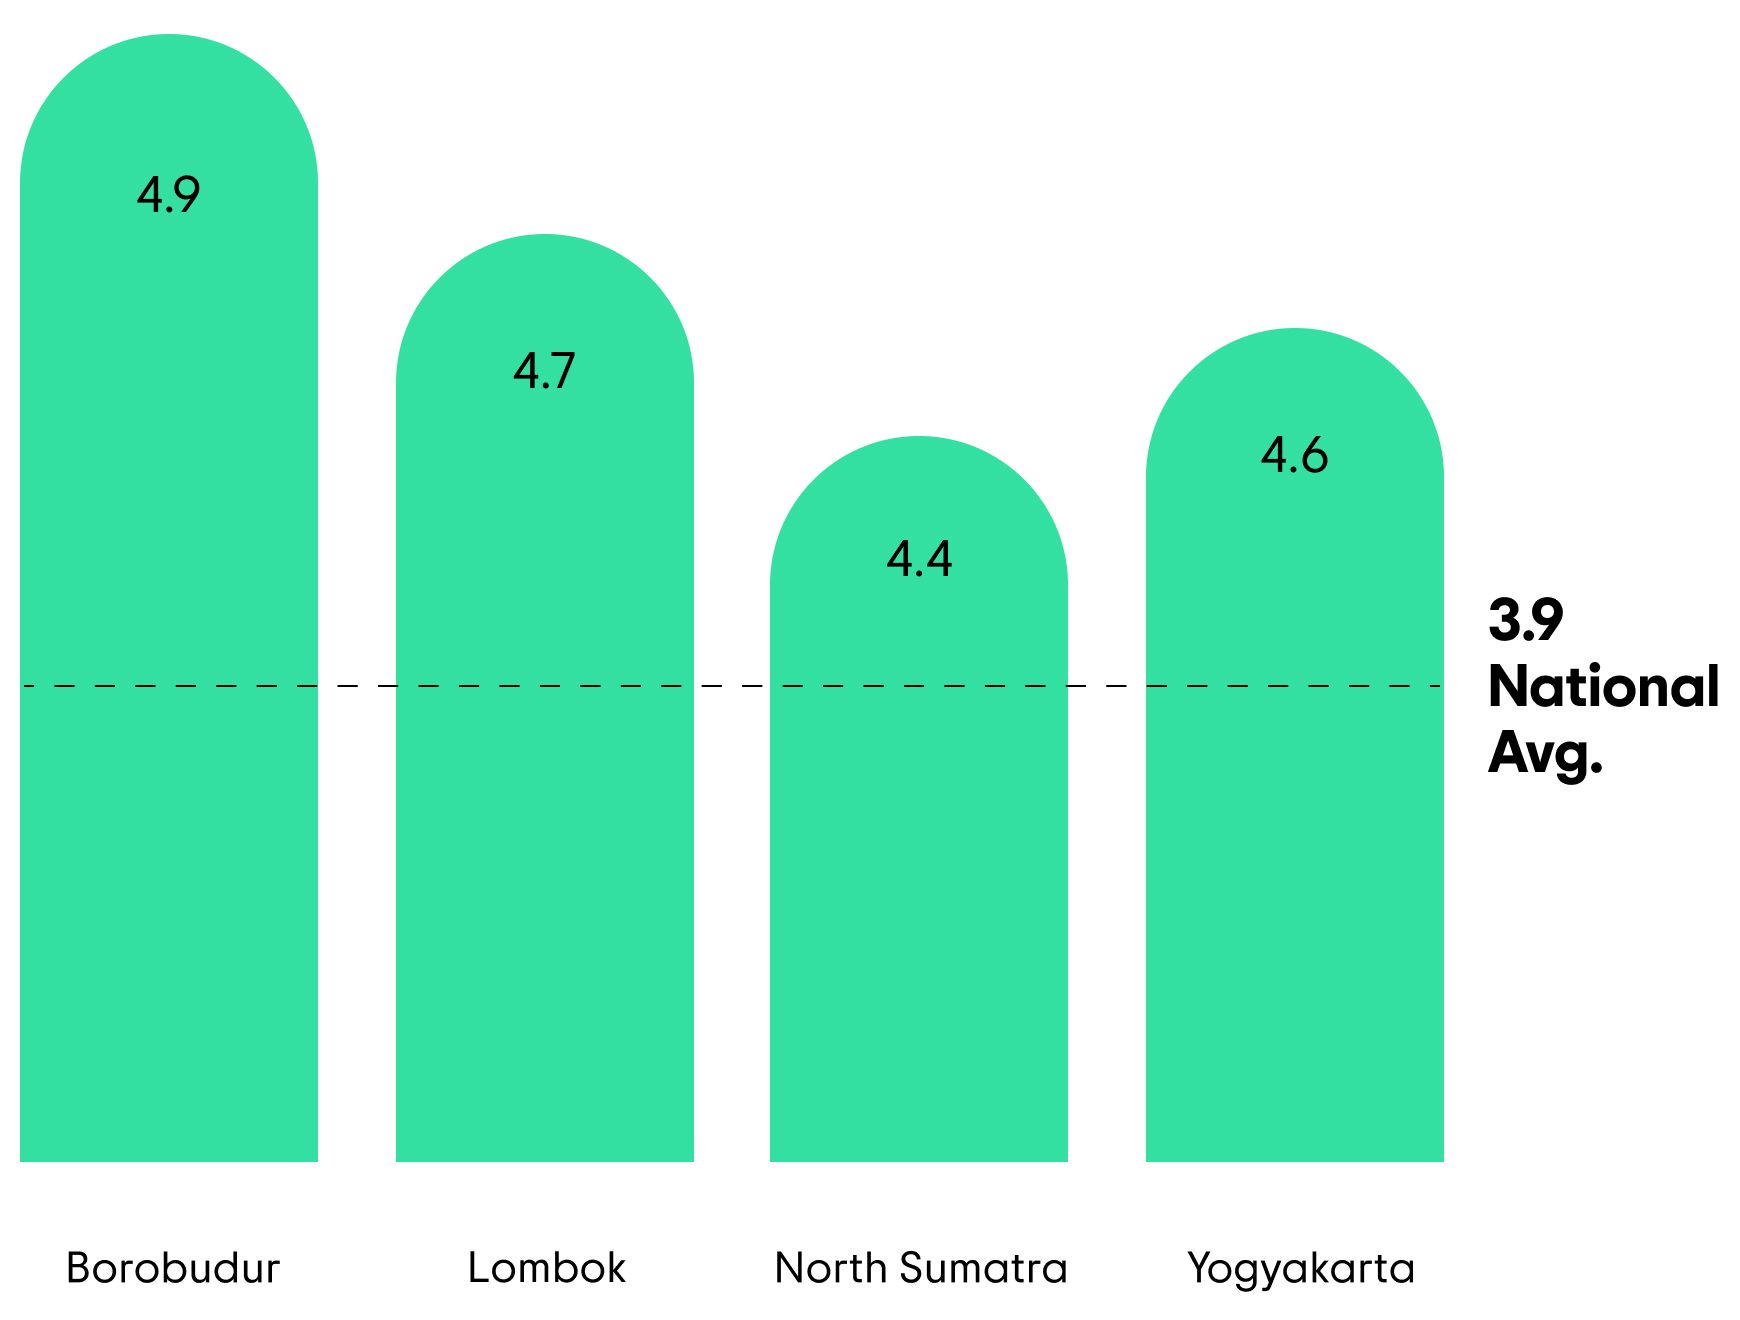
Bubble Score across categories:
Accommodations

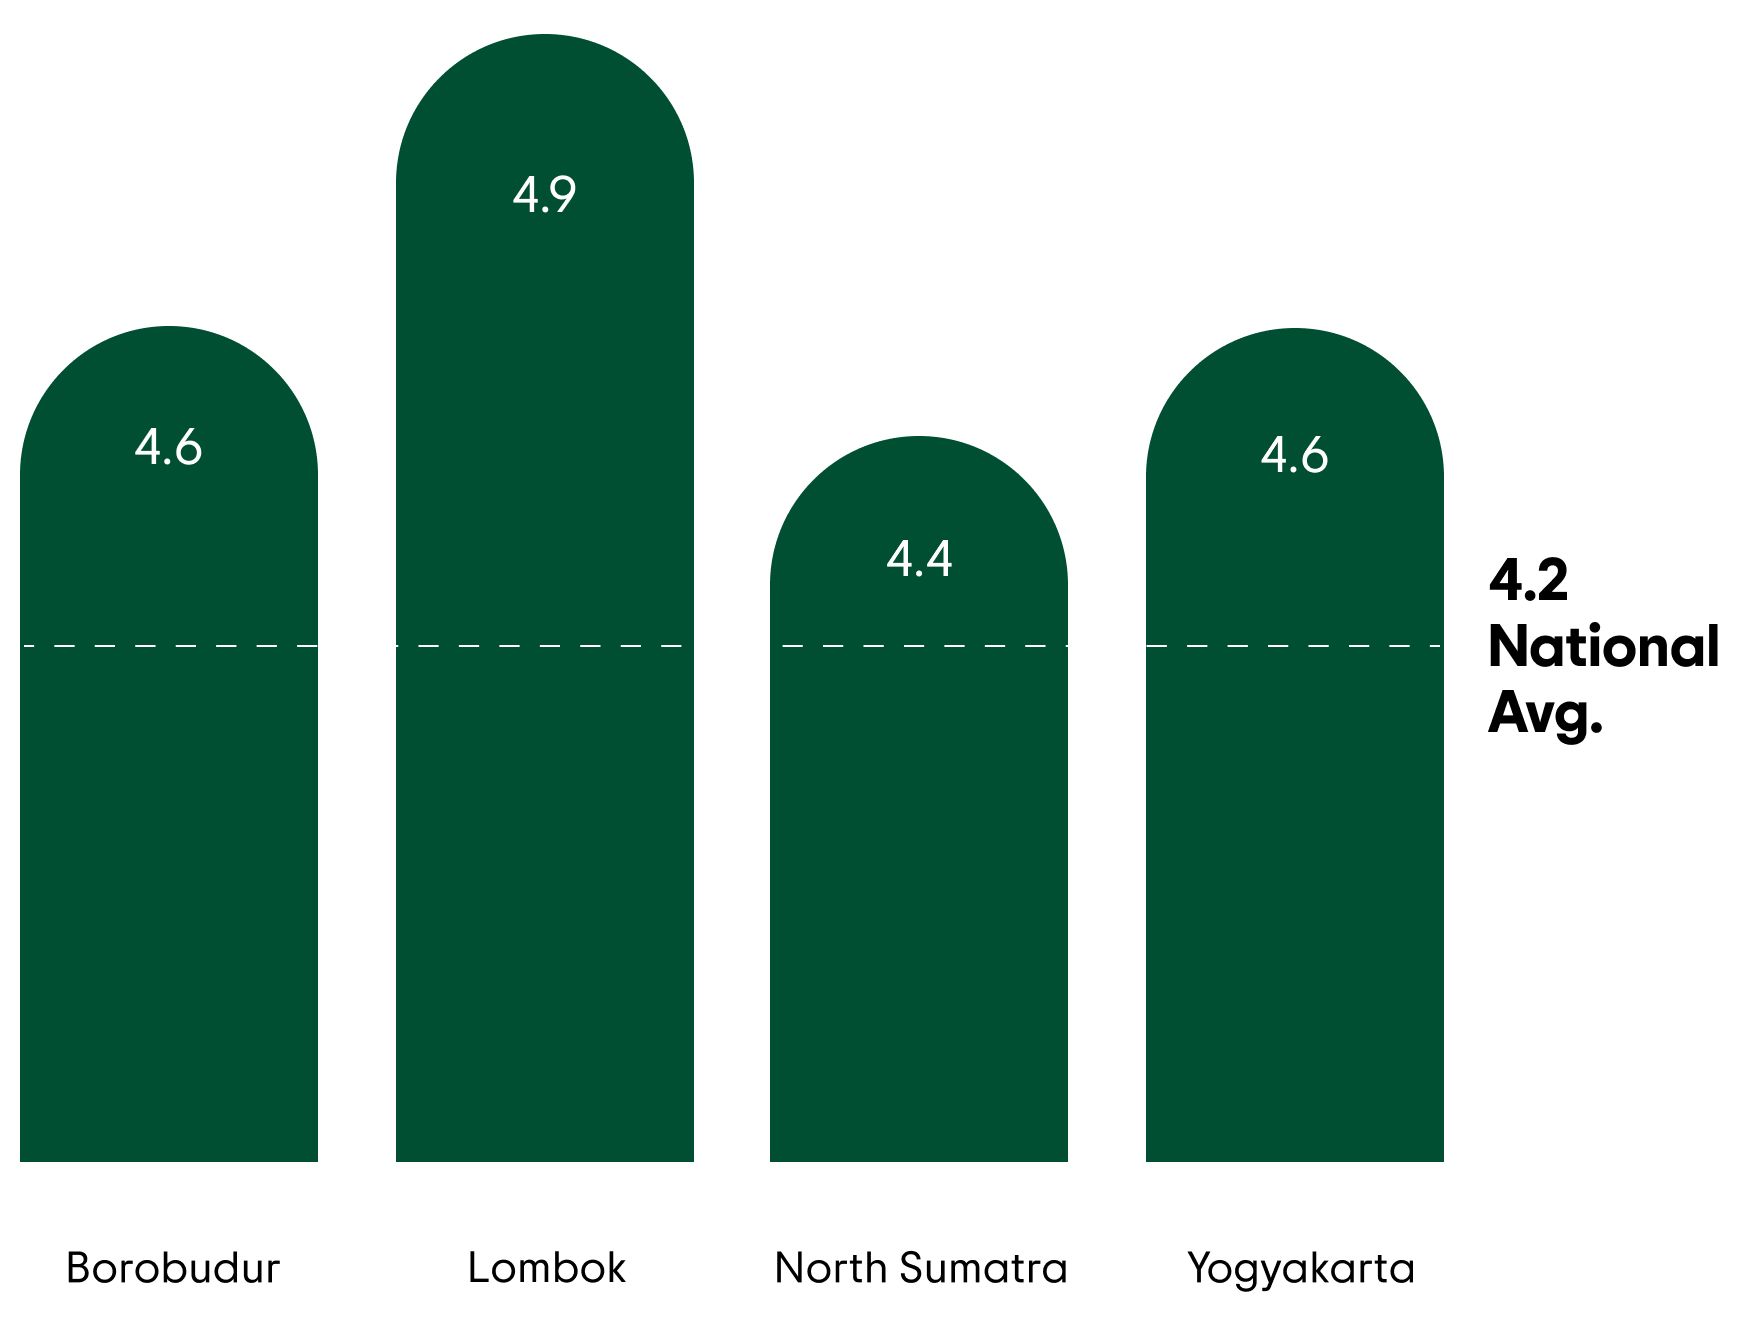
Bubble Score across categories:
Attractions
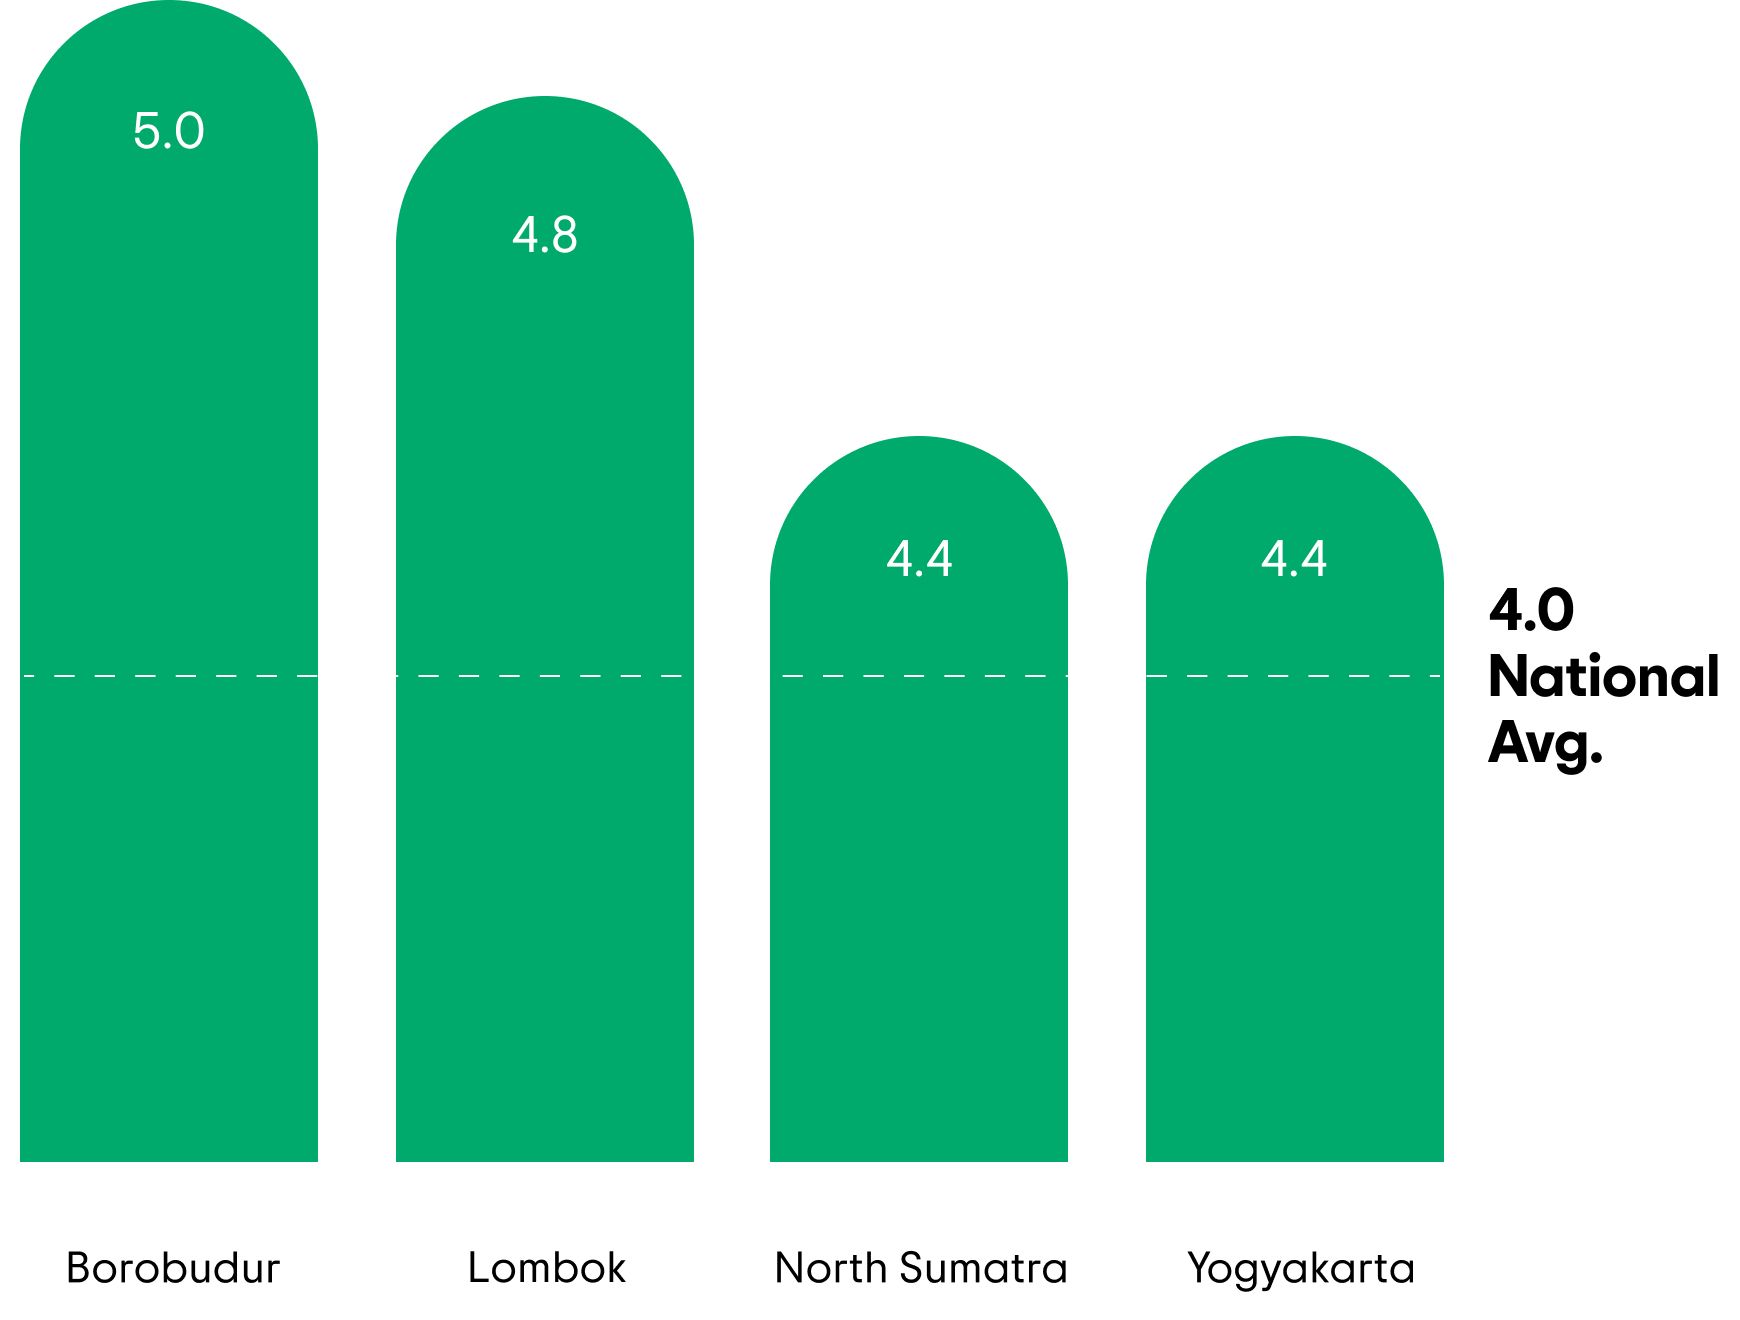
Bubble Score across categories:
Eateries


Bubble Score across categories:
Accommodations
Bubble Score across categories:
Attractions
Bubble Score across categories:
Eateries

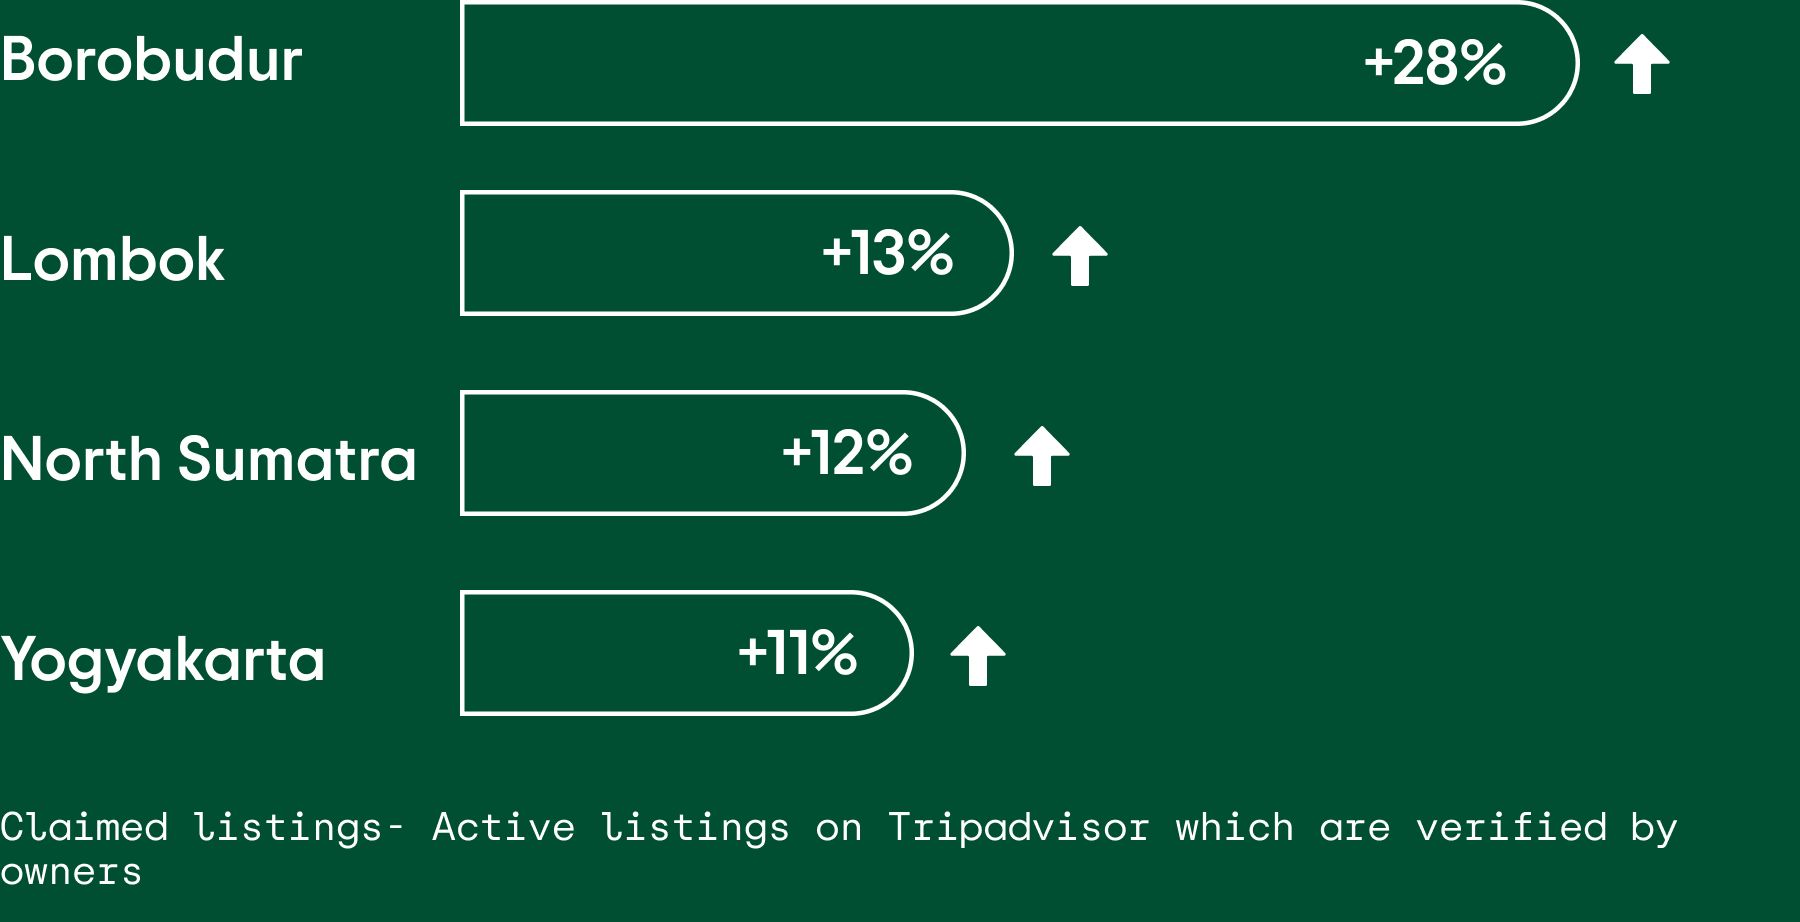
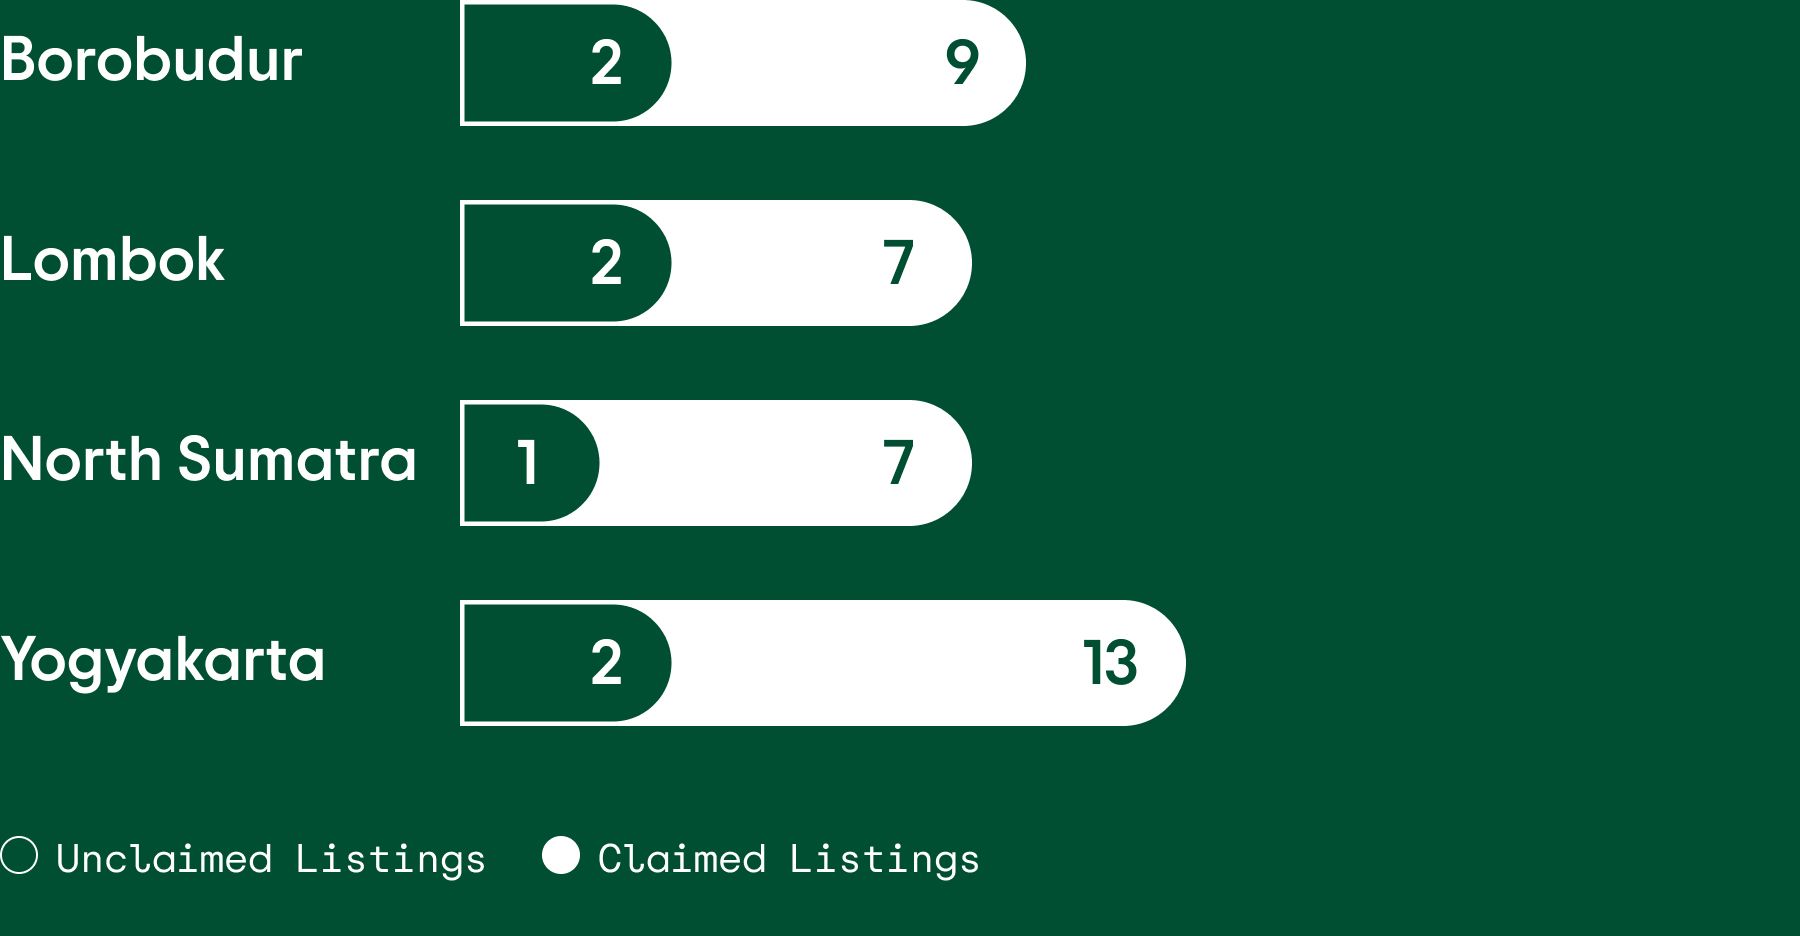
% Growth on Claimed Listings

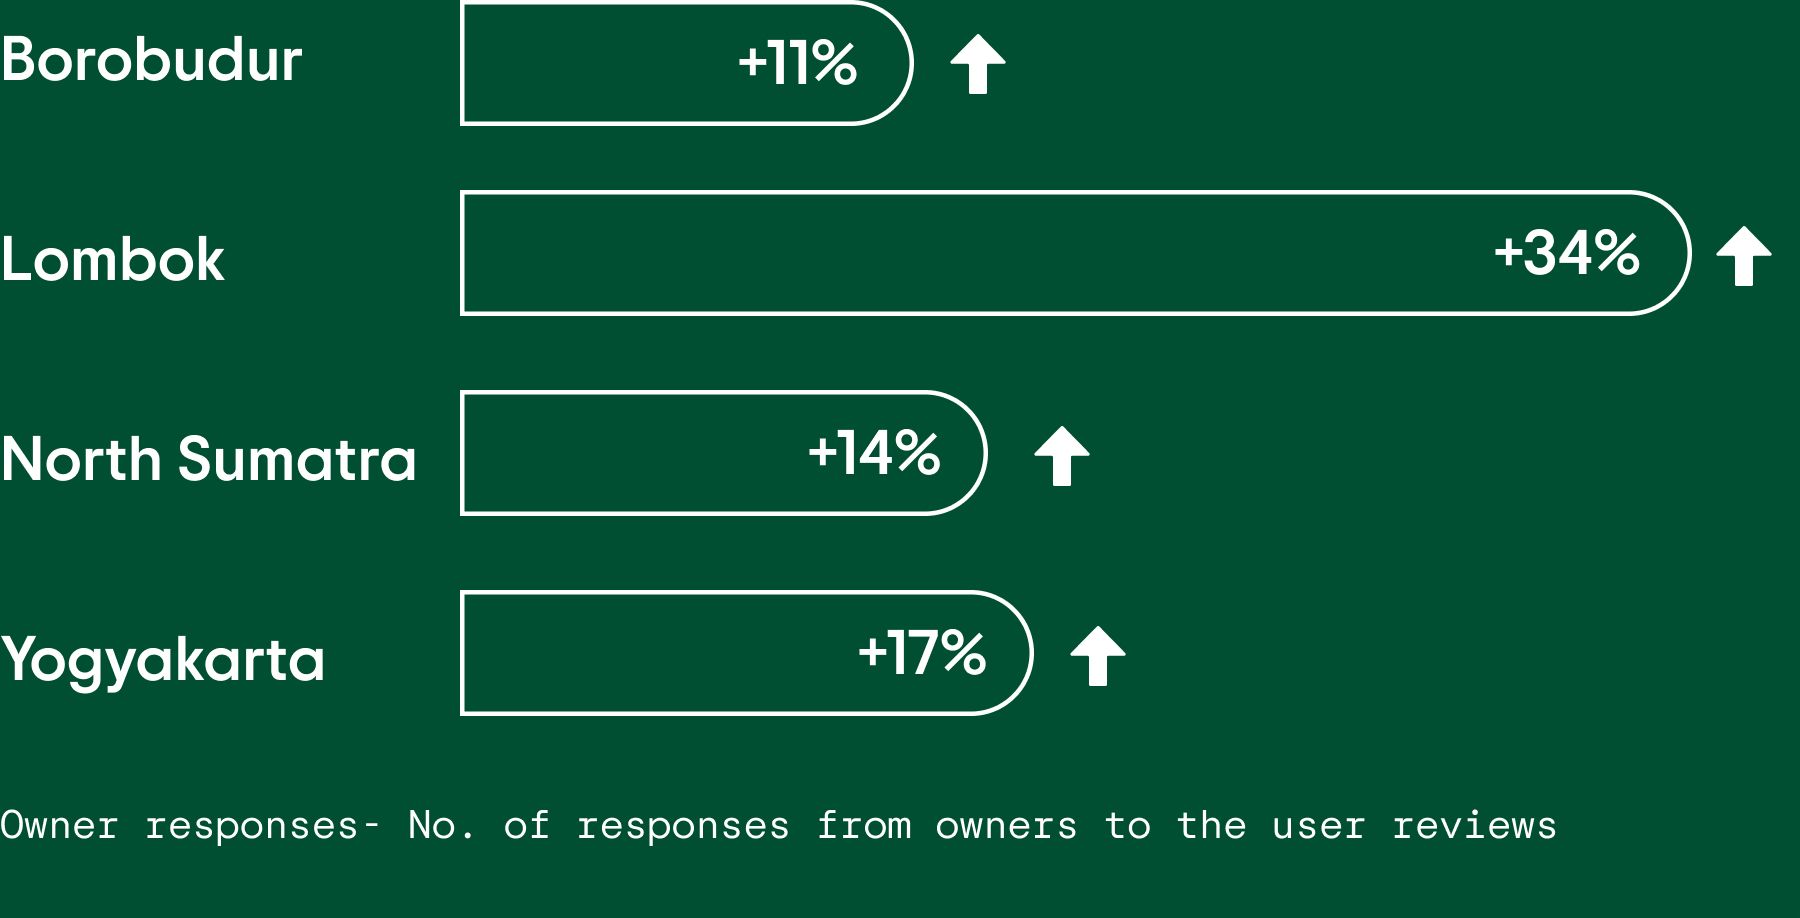
%Growth on owner responses:
Showed double-digit growth on owner responses in just 3 months

- Current stats show that with the improvement in the number of claimed listings as well as owner responses, the intent to book these destinations has also increased. Recently in the month of April 2022, there was double digit growth on intent to book (hotel click traffic) for all 4 destinations compared to September 2021. Tripadvisor began sharing these data insights with Tourism Boards and destination property owners in October 2021.
- Claimed listings also leads to more visibility on destination pages. The no. of reviews on listings which are claimed are much higher than the ones which are not claimed. Based on recent findings, Tripadvisor users are 40% more likely to have travel influence based on online reviews from other travellers. (source: GWI, global users on Tripadvisor; Q4 2021) which highlights the relevance of having reviews on these destination pages.
Average review per listing


% Growth on Claimed Listings
%Growth on owner responses:
Showed double-digit growth on owner responses in just 3 months
- Current stats show that with the improvement in the number of claimed listings as well as owner responses, the intent to book these destinations has also increased. Recently in the month of April 2022, there was double digit growth on intent to book (hotel click traffic) for all 4 destinations compared to September 2021. Tripadvisor began sharing these data insights with Tourism Boards and destination property owners in October 2021.
- Claimed listings also leads to more visibility on destination pages. The no. of reviews on listings which are claimed are much higher than the ones which are not claimed. Based on recent findings, Tripadvisor users are 40% more likely to have travel influence based on online reviews from other travellers. (source: GWI, global users on Tripadvisor; Q4 2021) which highlights the relevance of having reviews on these destination pages.
Average review per listing


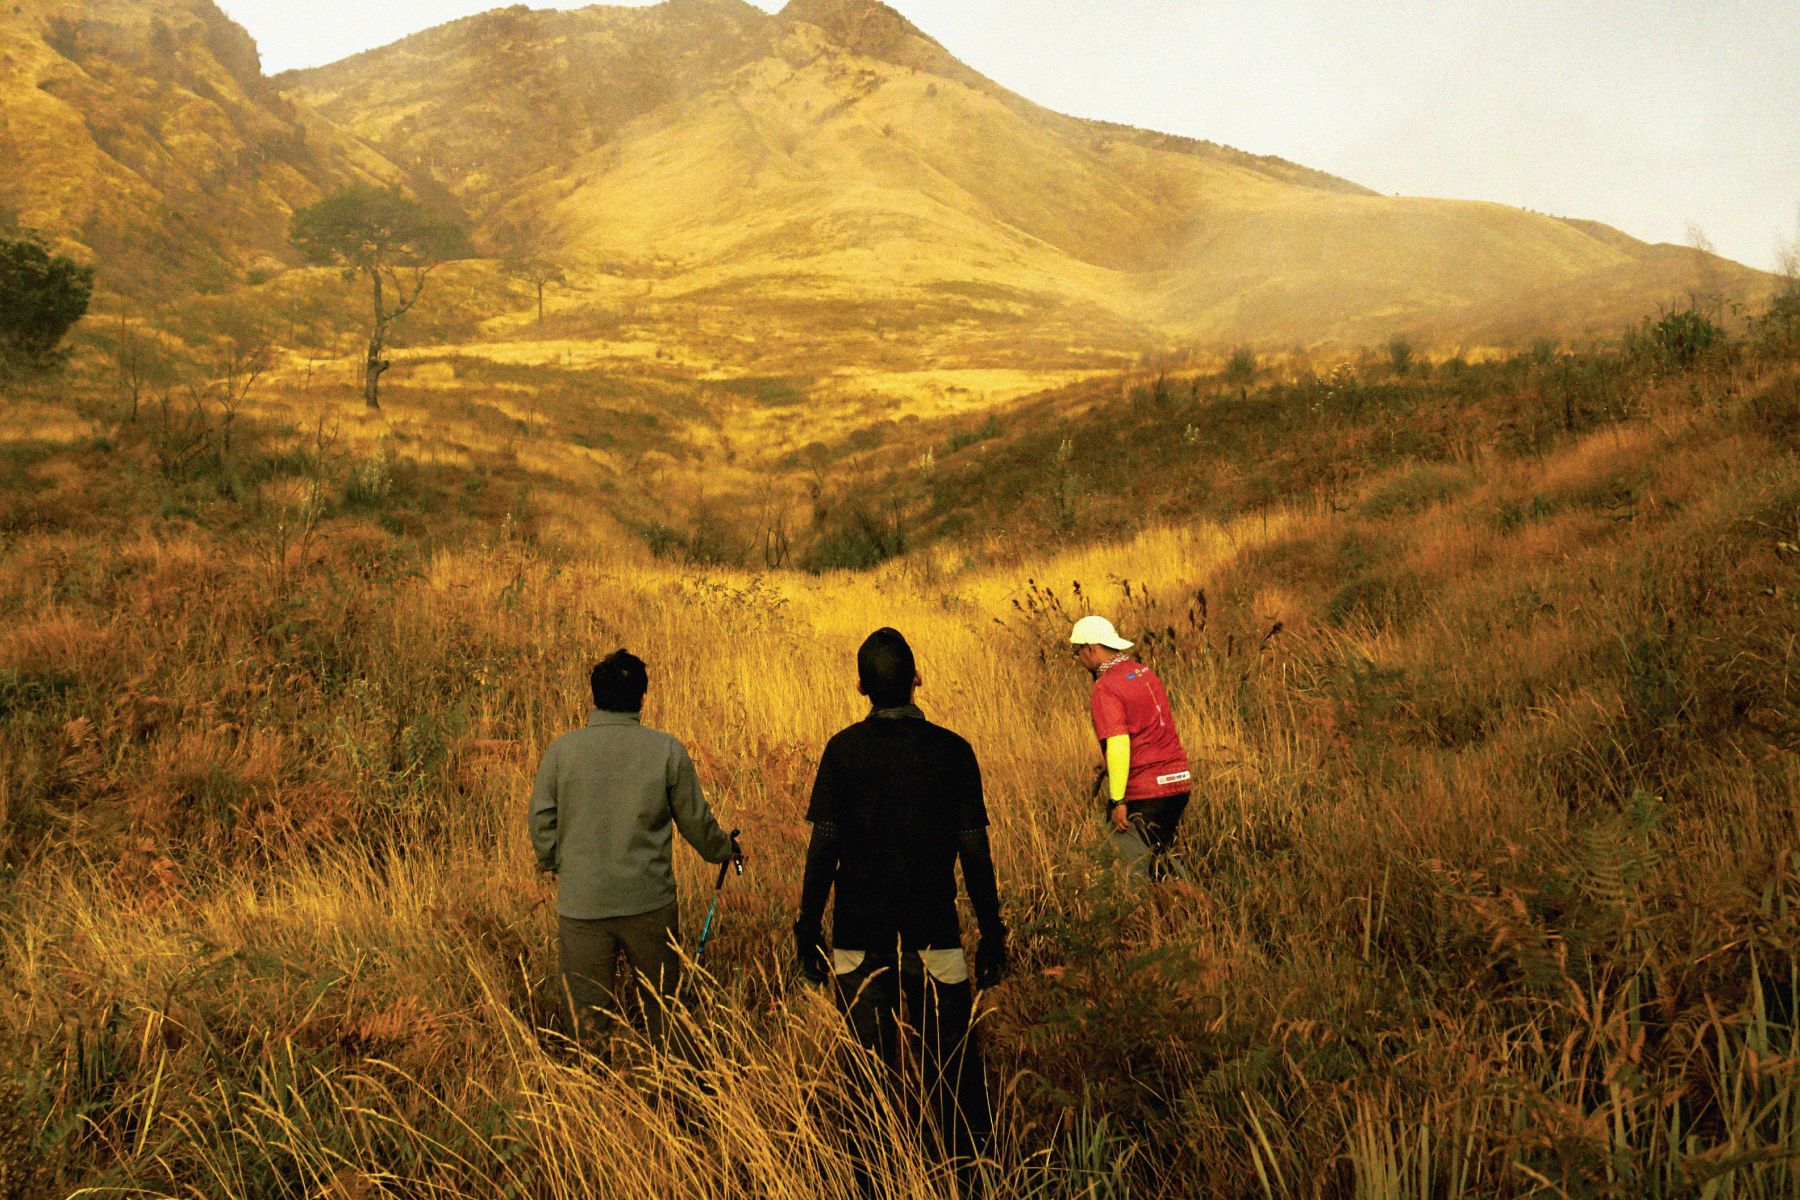
- Outdoor activities are on the rise; and showed major rebound in number of reviews last summer (Jul-Aug 2021) with +670% growth compared to 2020, showing upward trajectory for this year as well.
- Compared to pre-pandemic time, traffic on outdoor experiences have increased now as travellers feel more comfortable outdoors where they can maintain social distancing. In 2021, share of reviews for Outdoor experiences were 29% across all categories where in 2019, they were only 15% which indicates growth of 14% post-pandemic.


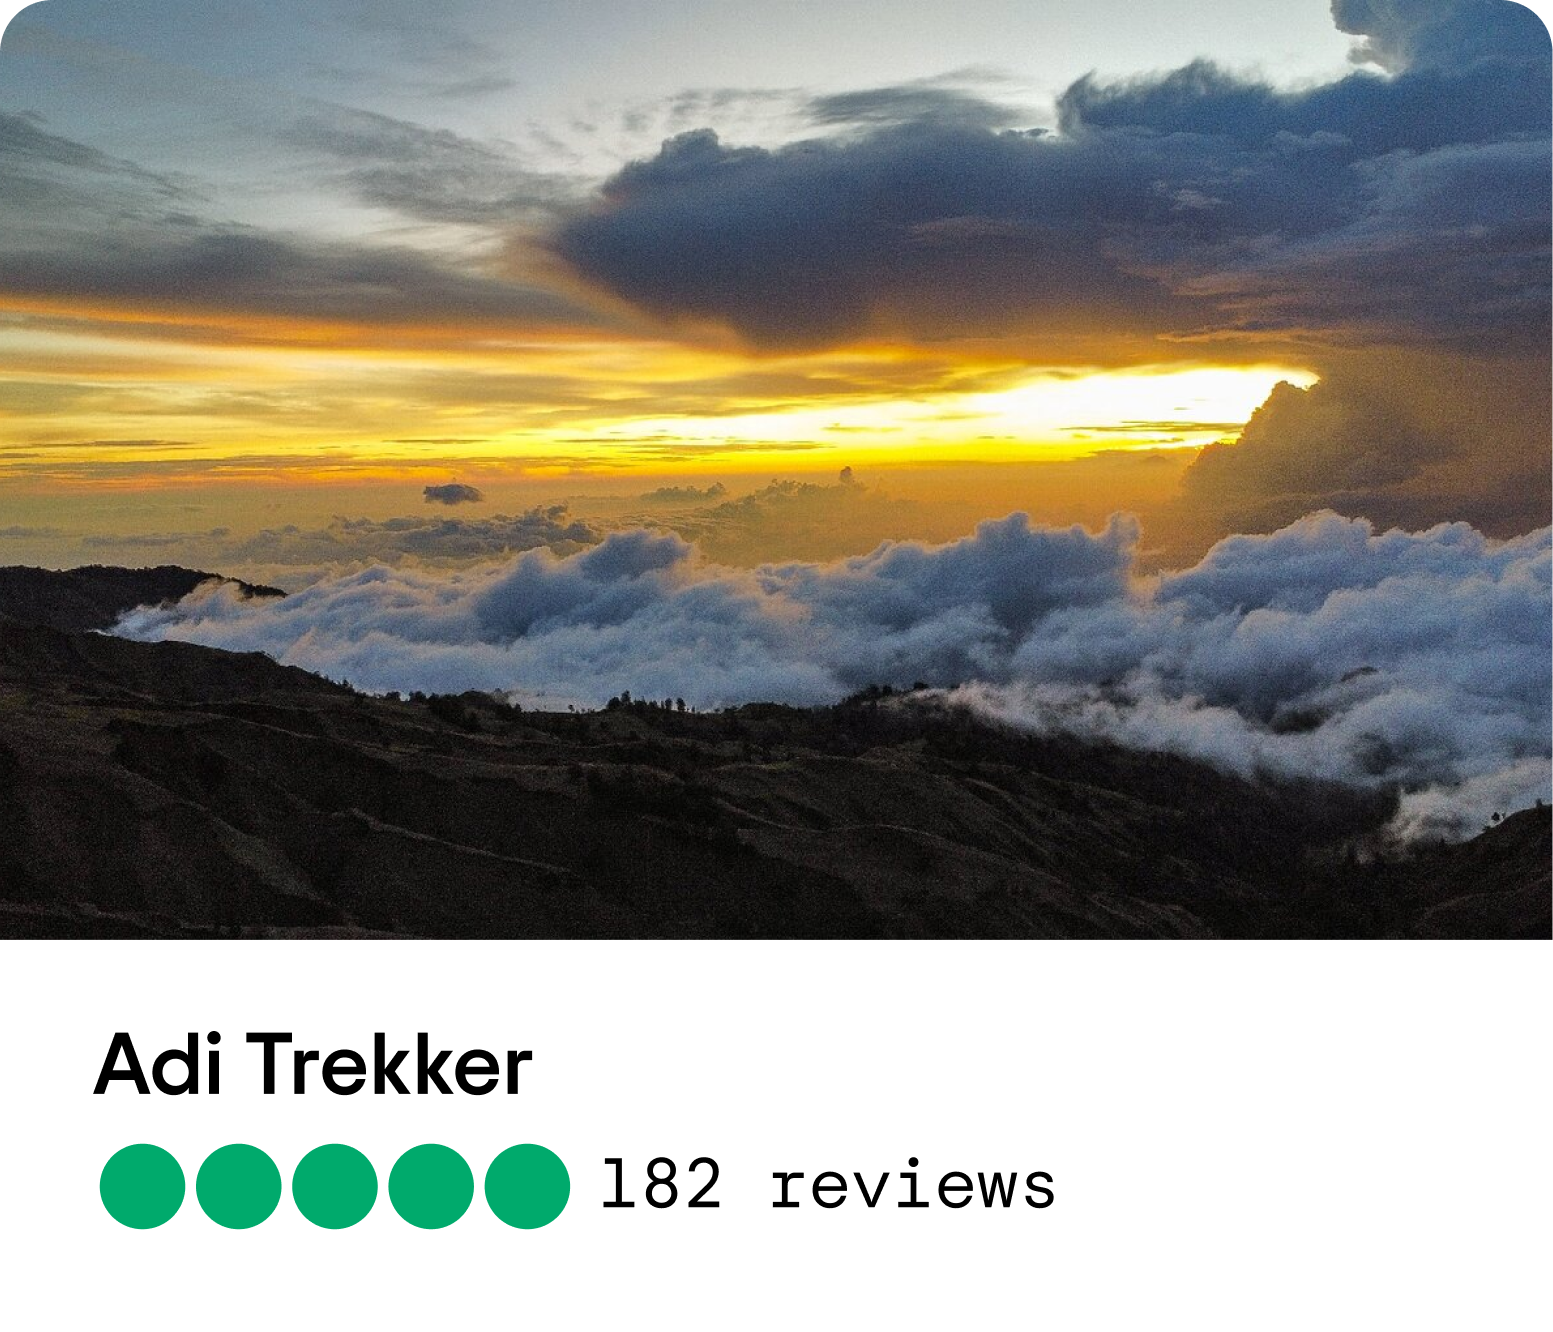
- With 182 reviews, ‘Adi Trekker’ is the most reviewed outdoor experience along with a 5.0 bubble rating.


- Outdoor activities are on the rise; and showed major rebound in number of reviews last summer (Jul-Aug 2021) with +670% growth compared to 2020, showing upward trajectory for this year as well.

- Compared to pre-pandemic time, traffic on outdoor experiences have increased now as travellers feel more comfortable outdoors where they can maintain social distancing. In 2021, share of reviews for Outdoor experiences were 29% across all categories where in 2019, they were only 15% which indicates growth of 14% post-pandemic.

- With 182 reviews, ‘Adi Trekker’ is the most reviewed outdoor experience along with a 5.0 bubble rating.

- Overall, Borobudur accommodation have the highest average bubble score of 4.9 across all properties. 87% of Borobudur properties have an average bubble score that is higher than the national average of 3.9
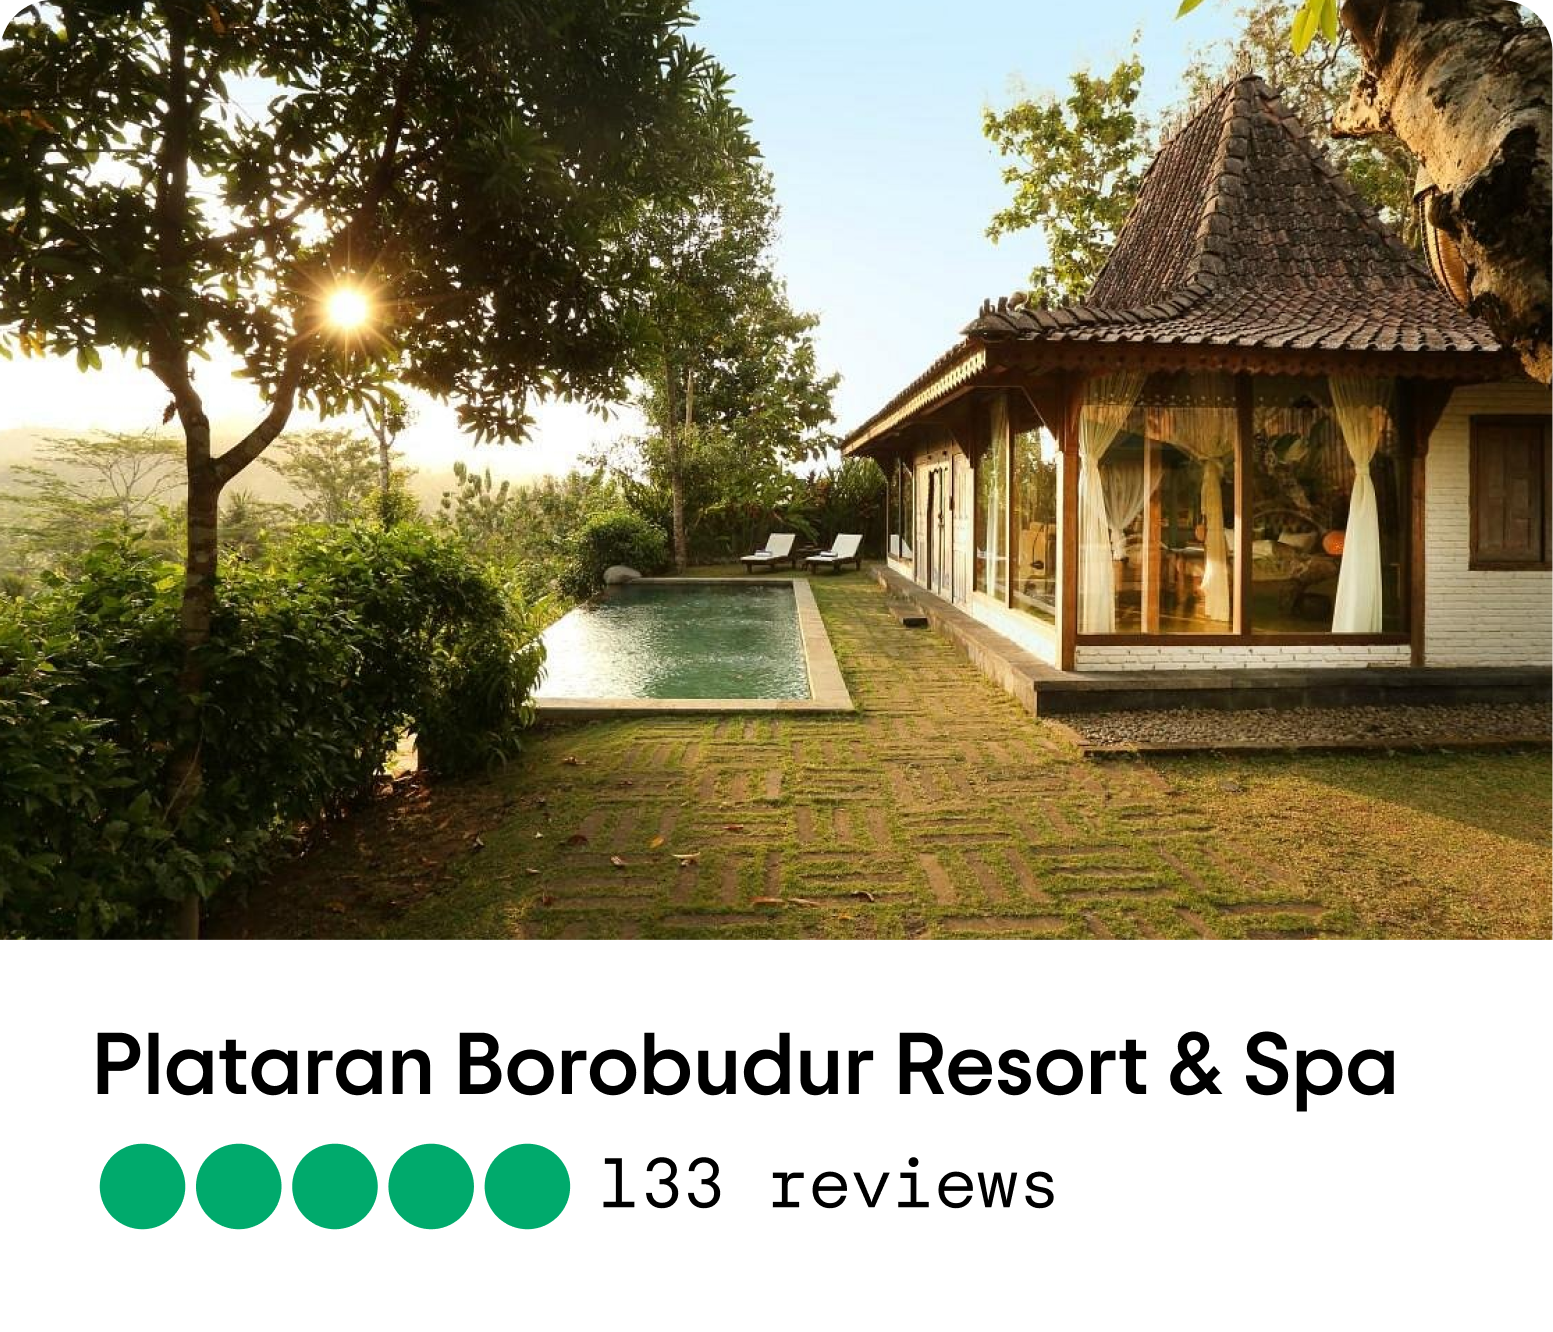
- Plataran Borobudur Resort & Spa gained popularity over the pandemic period, becoming the #1 most reviewed accommodation, with 133 reviews and a bubble rating of 4.9 since 2020.


- Overall, Borobudur accommodation have the highest average bubble score of 4.9 across all properties. 87% of Borobudur properties have an average bubble score that is higher than the national average of 3.9
- Plataran Borobudur Resort & Spa gained popularity over the pandemic period, becoming the #1 most reviewed accommodation, with 133 reviews and a bubble rating of 4.9 since 2020.


- Tours remained popular pre and post pandemic maintaining #1 position across all experience types with 36% share of total reviews. Here Tours refers to guided trips listed on Tripadvisor by tour operators.
- Tours also remained high on quality, experienced by travellers with consistent bubble rating of 4.9 since 2019
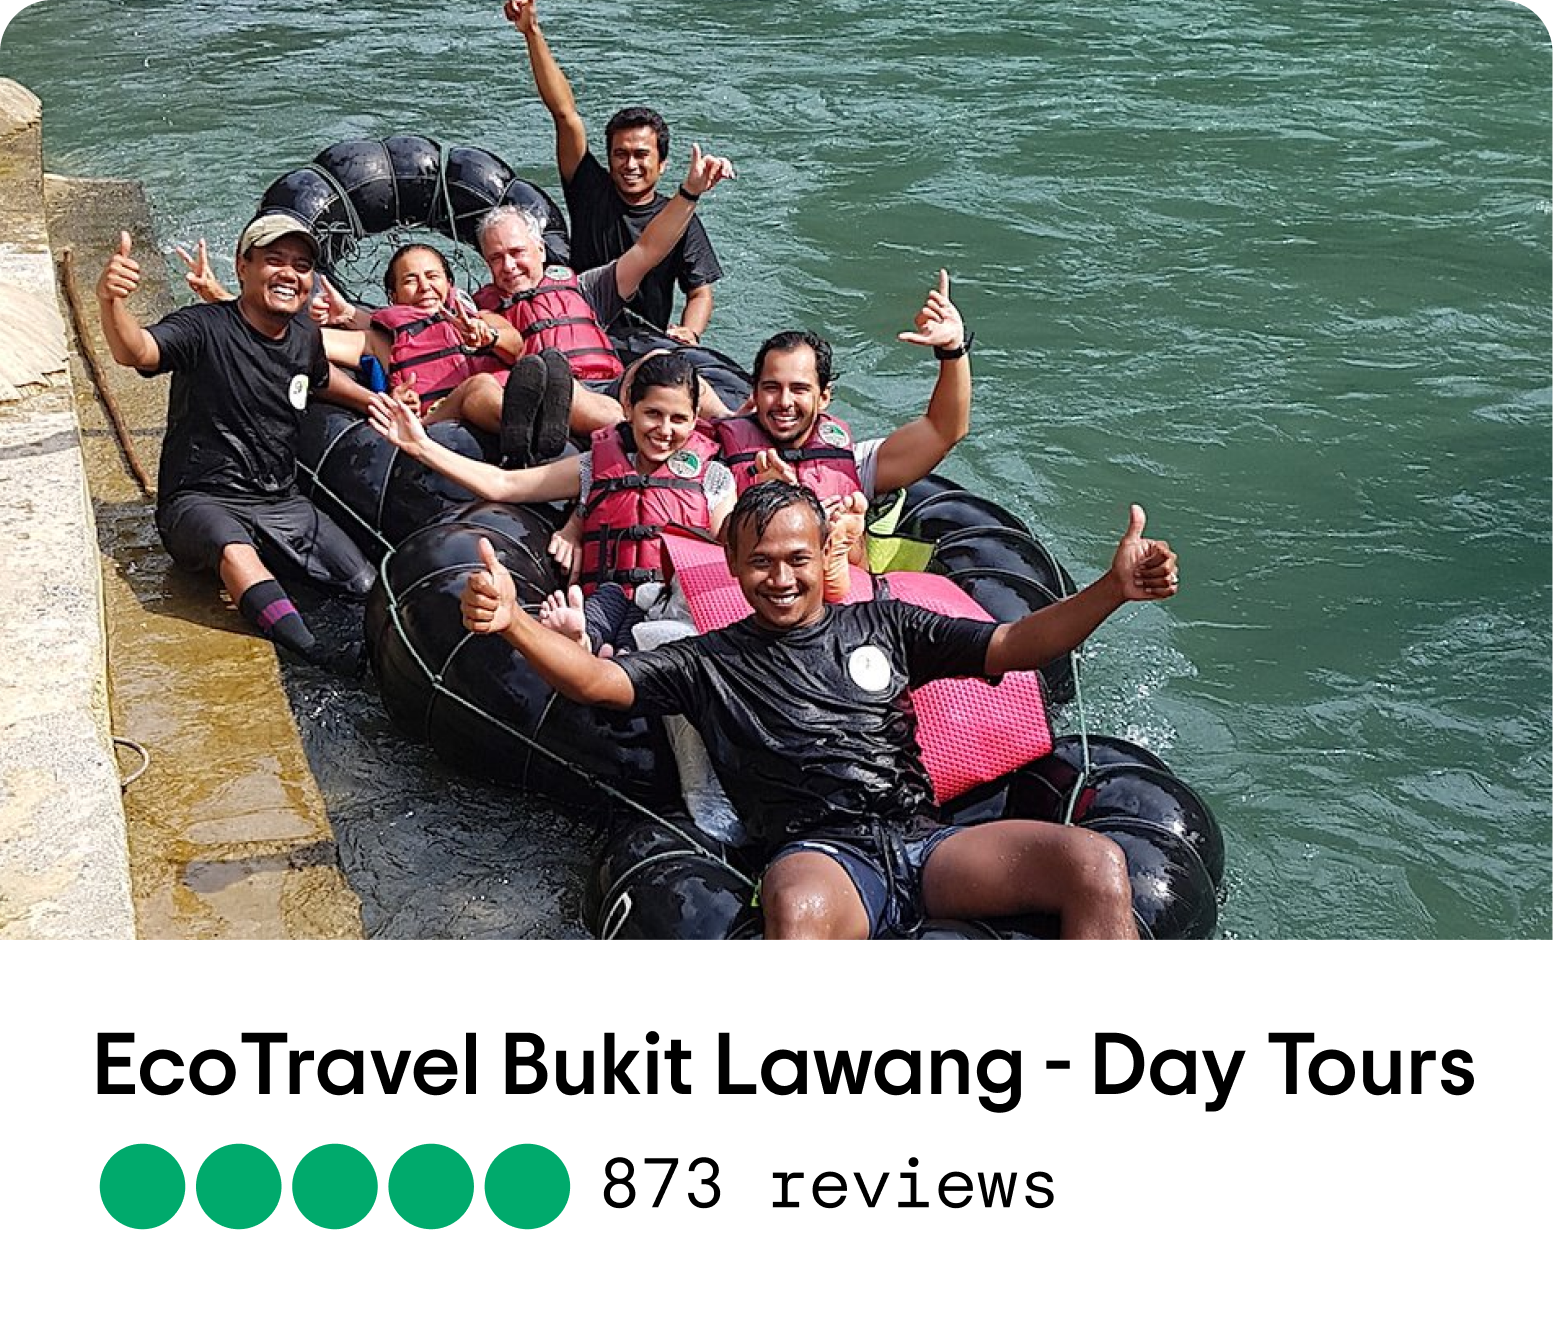
- EcoTravel Bukit Lawang - Day Tours is ranked #1 in tours in North Sumatra.


- Tours remained popular pre and post pandemic maintaining #1 position across all experience types with 36% share of total reviews. Here Tours refers to guided trips listed on Tripadvisor by tour operators.
- Tours also remained high on quality, experienced by travellers with consistent bubble rating of 4.9 since 2019
- EcoTravel Bukit Lawang - Day Tours is ranked #1 in tours in North Sumatra.

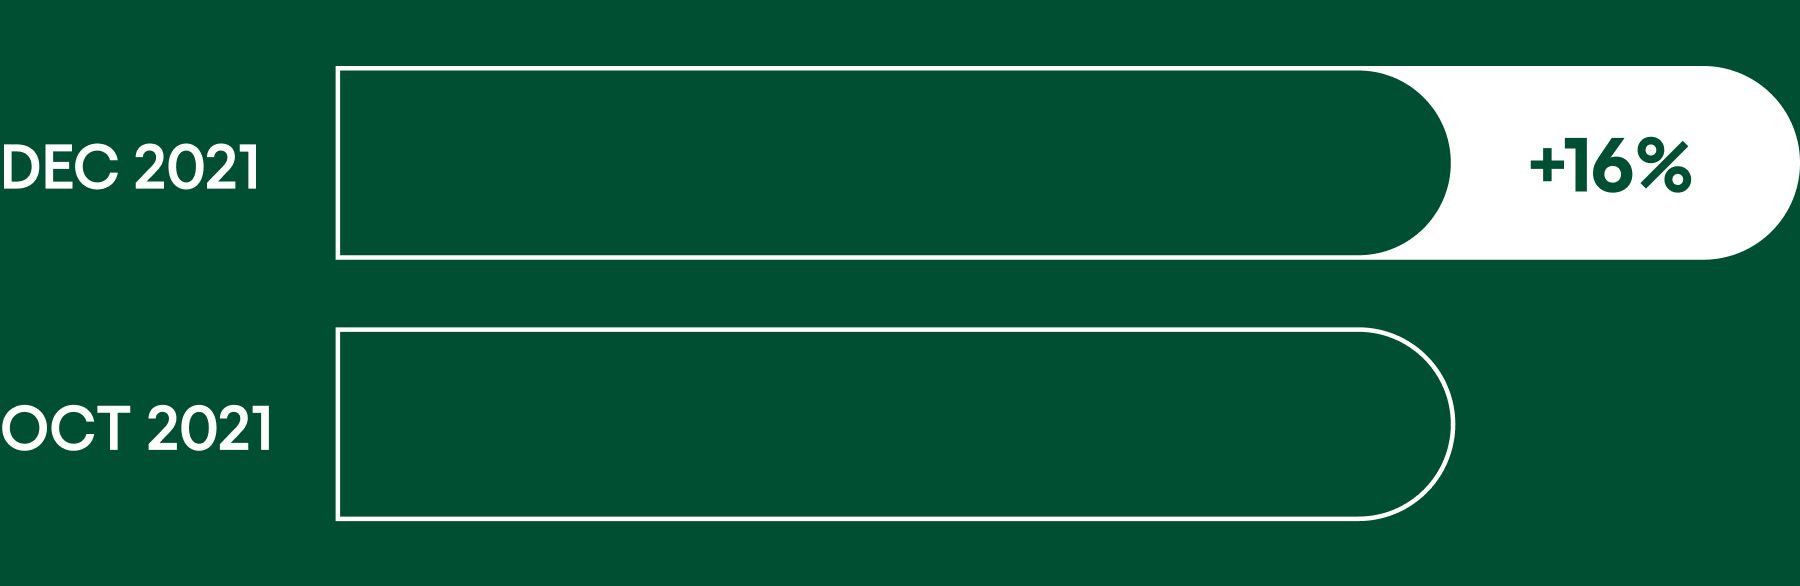
- Shopping stayed the #1 activity for tourists with a 40% share of visitation traffic across all experiences even during the Pandemic as travelers explore and buy first in class handicrafts from popular spots like Malioboro Road and Jogja City Mall.
- Shopping is on the rise with international tourists as % share of traffic grew by +16% month-on-month by the end of 2021 compared to 3 months back in Oct 2021.